


Tumultuous Trade Trilemma
- Aug 10, 2025
- 7 min read

The magnificent seven stocks have supported global growth over the last few years, driving a divergence between the US and the rest of the world. The winds of political change and the new US trade policy are imperiling the permanence of American exceptionalism. First, expanding tariffs will lead to countermeasures against US exports, ultimately decreasing global efficiency. Second, higher prices will lower demand for a price-sensitive US consumer, obviating the need to invest in US manufacturing. Third, the political objective of increasing US exports is incompatible with the first two objectives. Furthermore, tariffs cannot generate sufficient revenue at the proposed rates to sustain income tax cuts, which would increase interest rate costs. This tumultuous trade policy could return global markets to the 1970s, or worse, the 1930s. Better to beggar thy neighbor than thyself.
Labor productivity has faced headwinds since the late 2010s, particularly in manufacturing, which started declining in 2017. High costs are the driver.
A high fixed manufacturing cost for the US versus the rest of the world, combined with softening demand for US exports, presents a precarious business model. Trade indeed.
Volatile. While the economy continues to grow, the volatility of trade policy is showing (Exhibit 1). After net exports fell in the first quarter, they rebounded a similar amount in the second quarter. The drivers are easily identifiable: a stockpiling of imports in advance of prospective tariffs in the first quarter, reversed in the second quarter as imports declined. A similar story unfolded for investment, as the AI build-up prompted forward goods purchases to avoid potentially heavy tariffs, resulting in a drop in investment during the second quarter. As long as trade policy remains volatile, so will trade and investment decisions.
Exhibit 1. GDP Contribution by Component

The rebound in consumption helps provide some degree of stability in the total, yet the absence of government growth is apparent. This poses a challenge for the Fed, which is attempting to achieve a soft landing of the economy, where policy loosens before employment declines. The trouble is that monetary policy is only loosely linked to consumption, which makes investment and net exports critical components of its decision-making set. Yet, trade policy-induced volatility is obscuring the picture for the Fed.
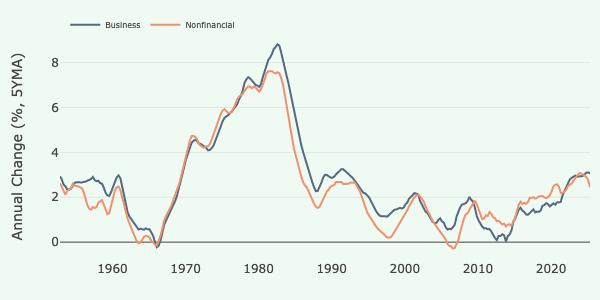
Production Paradox. The US labor force is productive: for over 50 years, it has added approximately two percent through productivity growth, except during a brief period from 2016 to 2020 (Exhibit 2). This outcome is not surprising, given the industrial capacity developed during and after World War II and the post-war focus on education (e.g., the GI bill). If a country focuses on investment in industrial capacity (e.g., land) and developing its human capital (e.g., labor), increasing labor productivity is expected. Yet, the third component, capital, is equally essential for growth.
Exhibit 2. Labor Productivity, % Change, Five-Year Moving Average

As capital became expensive, its deployment wanes. The high interest rates, and thus the cost of capital, impaired productivity growth in the late 1970s and early 1980s. This situation reversed as interest rates fell to secularly low levels in the late 1990s. Capital was deployed at an increasingly higher rate, and labor benefited from the implementation of new technology, resulting in peak productivity in the early 2000s. Yet, trade turmoil between 2016 and 2020 resulted in a decline in productivity, as high fixed costs in industrial capacity faced diminished demand for US exports. The result was fewer sales as slowing exports resulted in fewer unit sales to spread the fixed costs.
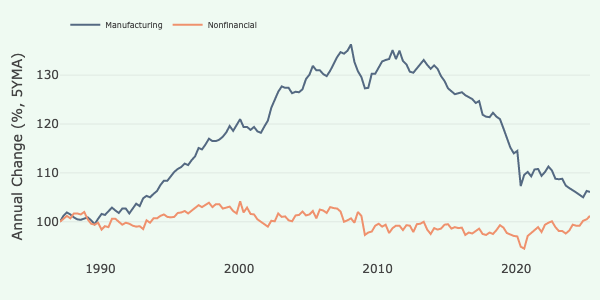
Ending Efficiency. As the trade turmoil permeates the current business environment, it’s helpful to view the initial bout of trade uncertainty, particularly in the manufacturing context. Despite China’s ascension to the World Trade Organization in 2001, the US remained an efficient producer of goods, whether durable or non-durable, for another 15 years. Starting around 2017, manufacturing productivity turned negative and only returned to positive levels in 2025 (Exhibit 3). A whole decade of lost productivity requires an explanation.
Exhibit 3. Labor Productivity Manufacturing, % Change, Five-Year Moving Average

The US economy is dominated by service-based consumption and technological prowess that is the envy of the world. It is not a question of human capital that impairs productivity: the top minds in the world flock to the US education system and its companies to compete against the world’s best. It’s not for a lack of capital, as the US is home to the largest and most liquid public capital markets in the world, and its private counterparts are the de facto global markets in their respective spaces. There is no apparent reason why the US lags in worker productivity for goods manufacturing, given the abundance of human and financial capital available.
Unit Costs. Productivity is a function of the labor and capital used to create the output. As capital becomes more expensive, the marginal contribution of capital to productivity declines. This outcome is evident during the 1970s inflationary period, when productivity fell, and is clearly indicated in the unit costs for the same period (Exhibit 4). Since the peak of unit costs in the early 1980s, unit costs have fluctuated around two percent, until they increased again during the pandemic in 2020. Yet again, the period around 2017 marks a turning point, as costs had previously fallen but then suddenly reverted to increasing. The catalyst was the prior impairment of trade.
Exhibit 4. Unit Costs, % Change, Five-Year Moving Average
The most astute business student understands that high fixed costs are a dead weight when sales decline, as the unit costs increase. During a period when trade is inhibited, unit costs would be expected to rise. The pandemic magnified the prior trend on a global scale. Thus, the US had to endure two burdensome outcomes: a self-induced demand constraint as trade slowed in the late 2010s and a supply-driven constraint wrought by the Pandemic. Indeed, it’s remarkable that unit costs didn’t rise further than they did.
Costly Goods. The information technology revolution, which has been unfolding for most of the past three decades, has significantly enhanced service productivity. This is evident in the overall productivity that continues to grow apace. A different story unfolded in durable goods, marked by a decline in productivity. The driver is like the overall measure: costs have risen since 2017 (Exhibit 5). The difference lies in a high-fixed-cost business's ability to pass those costs along in a price-sensitive global market. This is a critical point: rising costs compress margins and, thus, productivity. This is a crucial point: rising costs compress margins, thereby affecting productivity and competitiveness. It’s one thing to want to reindustrialize the economy; it’s entirely another thing to find customers for high-cost goods.
Exhibit 5. Unit Costs Manufacturing, % Change, Five-Year Moving Average

A significant share of industrial production, particularly durable goods, has left for the shores of Asia, but the US remains a leader in advanced technologies (e.g., information technology and military). This position enables them to set prices for their goods. Yet, a trade war delivers the perverse outcome of losing sales of high-margin goods in exchange for low-margin goods. Some business models are better than others.
Production Productivity. America led the industrial world into the twentieth century, which significantly contributed to the Allied victory in World War II. This industrial capacity waned in the US’s production, not in the value created, as industrial production has grown since the end of the war. Capital and industrial goods are the most significant export sectors, reflecting their high value-added and comparative advantage. Remarkably, US manufacturing productivity withstood the emergence of Japan, Korea, and China as major export competitors. It is only in the last decade that US productivity has declined relative to overall productivity (Exhibit 6). Costs are a material driver of this lost productivity.
Exhibit 6. Productivity Ratio by Sector
This is the crucial point: productivity is partially a function of costs. Creating low-priced goods at a high cost is not a sustainable business model, even if the US were to close its borders to trade. The reduced trade would raise costs for all goods and services in the US, including those produced domestically. This outcome, however, is not the challenge. As the former Soviet Union discovered and Adam Smith long ago recognized, trade is good, particularly when a country, like the US, has a comparative advantage in goods and services. Losing a market for high-value goods seems unwise.
Strategic Folly. The adage ‘do not interrupt your competitor when they are making a mistake’ holds. The US total factor productivity is a world leader, critically, in high-value-added goods. Strategic competitors, including Germany and Japan, remain at a similar level of productivity (Exhibit 7). Yet, the most important rival, China, is fading as it reaches the limits of its industrial build-up. The emerging rival, India, enjoys material productivity growth; however, it remains at a significantly lower development level than China and is not comparable to the US and its peers.
Exhibit 7. Total Factor Productivity, 10-year annualized change.

The US is embarking on a trade policy that will limit its own growth. Tragically, this is occurring at a time when its principal rival, China, is in decline. This situation will deliver disinflationary pressures to world trade as China attempts to sustain its growth. The US could leverage this action to its benefit by continuing to trade with China low-value-added goods, while focusing on the goods and services that will lead the next industrial revolution. This strategic decision would enrich the US more than reshoring inefficient and costly production of globally traded goods, where the US is a price-taker. It is much better to focus on those goods where the US is a price-maker.
This is the macro view of CRM's US Economic Outlook for Q2 2025. Read the complete report here.
Thói quen của tôi là đọc nhanh các bài giới thiệu khi dùng điện thoại, nên tôi đánh giá cao những nội dung được trình bày gọn gàng. Bài viết này làm khá tốt điều đó khi phần https://789f.mba/ không bị đặt quá lộ liễu. Thay vào đó, nội dung được triển khai mượt mà, tập trung vào trải nghiệm và các danh mục giải trí quen thuộc, giúp người đọc dễ hình dung tổng thể.
Whether you're a casual player or a fan of idle games, Planet Clicker free has something for you. The upgrades feel meaningful, and unlocking new planets gives a real sense of achievement.
j88 mình cũng chỉ ghé thử cho biết vì thấy mọi người nhắc hoài, kiểu vào lướt vài phút rồi thoát. Vừa mở ra thấy giao diện khá sáng sủa, nhìn “dễ thở” chứ không bị nhồi chữ, kéo xuống tới đâu là hiểu tới đó. Mấy khối nội dung chia tách rõ ràng nên không có cảm giác rối, nhất là phần giới thiệu họ viết gọn, đọc nhanh vẫn nắm được ý. Mình có để ý đoạn nói về nạp rút, họ trình bày khá thẳng, không vòng vo nên nhìn cũng yên tâm hơn chút. Nói chung trải nghiệm lướt ổn, bấm qua lại không bị lạc, và mấy box thông tin được canh khoảng trắng khá…
U888.com mình thấy nhiều người nhắc nên tò mò bấm vào xem thử giao diện thế nào thôi. Mình không có ngồi soi từng mục hay chơi gì cả, chủ yếu lướt qua để xem trang sắp xếp có dễ nhìn không. Ấn tượng đầu là bố cục chia theo khối khá rõ ràng, nhìn một cái là biết chỗ nào là chỗ nào, không bị nhồi chữ quá nhiều nên đỡ rối mắt. Mình cũng thích kiểu menu để ngay chỗ dễ thấy, bấm chuyển qua lại giữa các phần khá nhanh, không phải tìm vòng vòng. Nói chung chỉ cần vậy là đủ để mình nắm sơ sơ khi mới vào, nhất là cách các khối nội dung…
net88.se.net mình thấy dạo này hay được nhắc nên cũng tò mò bấm vào xem thử giao diện thế nào. Mình chỉ lướt nhanh chứ không đào sâu nội dung, chủ yếu xem họ trình bày thông tin có dễ nhìn không. Ấn tượng đầu là bố cục khá thoáng, các phần nội dung được chia thành từng khối rõ ràng nên kéo xuống không bị ngợp. Có đoạn họ nói về hướng “minh bạch & bảo mật” và nhắc tới cơ chế giám sát kiểu pháp lý, đọc lướt qua thấy họ để thông tin theo kiểu gọn gàng chứ không nhồi nhét. Menu đặt chỗ dễ thấy, chuyển qua lại giữa các mục cũng mượt, và mấy tiêu…